Risk and Reward
There is a natural assumption in almost every aspect of life that, from playing a cricket shot to investing in the stockmarket, there is a trade off between risk and reward. But when it comes to investing, one of the most common mistakes is to look at returns, at forecasts, at earnings growth and dividends, without putting them in perspective. Without relating them to risk.
Easily said, but of course many people get lost when it comes to risk. They don’t consider it because they don’t understand it. So what is risk and how do you measure it? If the average man could just find a benchmark against which to measure risk, things would be a lot easier. So here’s a quick explanation, it’s actually quite simple.
In the financial world, the measurement of risk highlights the difference between an investment whose returns fluctuate wildly and one that doesn’t.
Take two stocks. Both return an average of say 5% a year. On the surface they look the same. But historically one stock’s annual return deviates from the average by 2% a year (so it can return 3% to 7% in any given year) and the other one deviates by as much as 10% a year (so it returns anywhere from minus 5% to plus 15%).
Clearly the first one is pretty predictable, boring even, and the second one is volatile, pinging around all over the place. The second stock is much more risky and it is clearly useful to know that before you compare the two and invest in one or the other. But on the surface, when you look at two stocks with exactly the same average return, you can’t tell.
That’s why, in order to judge the suitability of an investment, you really to assess risk as well as return and the measure we use is called standard deviation. It is a measure of the volatility of returns or in common parlance, it is a measure of how reliable your expected returns are. Most simply it is a measure of the average (or standard) difference (deviation) of a stock’s past returns from its historic average return and there is an assumption of course that an investment will continue to display the same amount of risk in the future.
So with our two example stocks, one has an average movement of 2% from the average return of 5% and the other displays an average 10% deviation from the average. And this is what a measure of standard deviation is. It is a measure of how far returns deviate from the mean. If many data points are close to the mean, then the standard deviation is small; if many data points are far from the mean, then the standard deviation is large. If all the data values are equal, then the standard deviation is zero. Clearly in this case the second stock is more risky.
Now back to risk and reward.
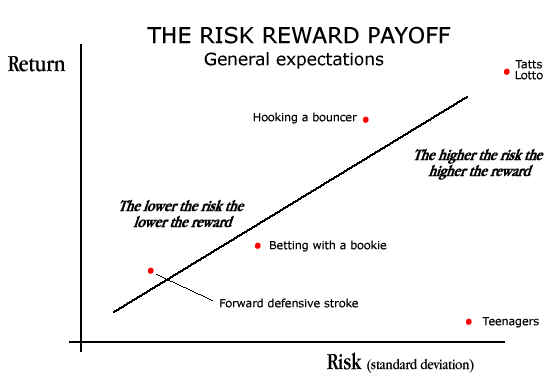
If you can measure the standard deviation (risk) and compare that to the average return (the reward) and do that for every possible investment in the world and plot them on a chart of expected return compared to standard deviation (risk), then you start to get a picture of what you should and shouldn’t be investing in.
In a perfect world then, a world that matched risk to returns without error, there would be a straight line from the bottom left hand corner of the chart (low risk low return) to the top right hand corner (high risk high return). We have been trained by hitting cricket balls and by betting with bookies to expect this. Bookies after all derive the odds, or expected returns, straight from the level of risk. Bookies are an example of someone who constantly prices risk against reward for a living and makes money from exploiting our ignorance or recklessness towards the relationship. Investors need to do the same thing and exploit the imbalances between price, return and risk.

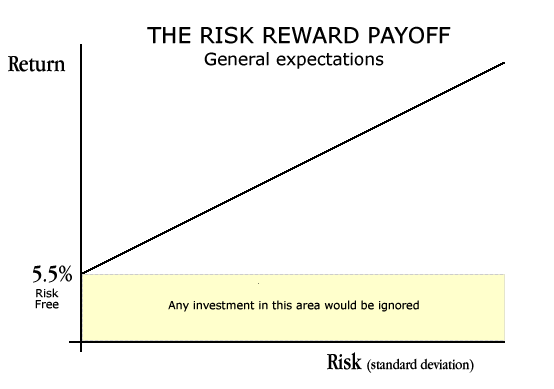
But before you go off and plot everything with a return against how risky it is let me just finish the lesson with one final addition to the chart. There is a base line all financial investments have to compare to. It’s called the risk free rate. It’s a simple thing. It’s the return you can earn without any risk at all. Traditionally in the investment markets this is represented by the return on government bonds, they are not strictly risk free as I’m sure Greek and Irish bond investors have found out but they will do.
The 10 year bond yield in Australia is currently 5.5%. So theoretically you can draw a straight line across your chart at a return of around 5.5% and any investment whose expected return is less than that but isn’t risk free can be instantly discarded. Why invest in a risky investment that returns less than a riskless investment. Pointless.

Where this gets interesting of course is when something plots above or below the expected return versus risk line. When the expected return does not match the risk. When an investment turns up as high return low risk, or low return high risk. They would stand out on the chart and be invested in immediately or discarded as stupidity.
So lets look at a few investments before tax, fees and inflation:
- The Stockmarket – Expected return of 12.01% (All Ords accumulation index compound return since 1979). Risk 4 out of 10.
- Bonds – 10 year return of 2.5%. Risk zero (ish).
- Paying off the mortgage – After tax return of 4.0% (Standard variable rate) which grosses up to 5.7-8% pretax depending on your tax rate. Risk zero.
- Tatts Lotto – Expected return of one million percent. Risk of a 100% loss is 9.99999999999 out of 10.
- Marriage - Expected average return of one extra income, zero to four kids, two possible inheritances, a free life coach even if you don’t need one, onerous school fees and a dog. Risk = long term love, fulfillment and satisfaction.
- Divorce – Expected return of minus 50%. Risks unknown.
The bottom line is that investors need to focus as much on risk as returns. You will make as much money out of spotting a stock or sector moving from high risk to low risk as you will spotting one moving from low to high returns. Changes in risk profile is why share prices move when forecasts haven’t.
Resources for instance have traditionally been seen as more risky than industrials but with China growing at 10% the perception of risk has changed and the money has flooded in. Retailers have become more risky because of the growing online segment. Banks are low risk but remain cheap and are underperforming because of the perception of lower returns.
Everything is risk and reward and prices are a combination of both. Looking at one without the other is like investing with one eye shut.