Set up to top out – Resources
We Are Set Up For The Top Of The Commodity Price Cycle
As you know we have enjoyed a fabulous run in the resources sector on the back of rising commodity prices helped to some extent by COVID supply issues. And more recently Russia’s invasion of the Ukraine has put a fabulous ‘froth’ on energy and metal prices. We are set up for a fall. Why? Lets see if you can follow this.
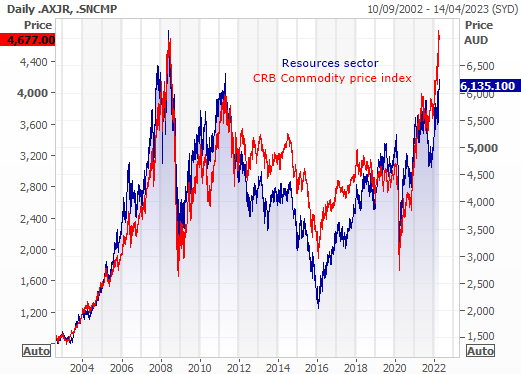
Here is the resources sector chart overlaid with the CRB Commodity prices index. The CRB index is the Commodity Research Bureau (CRB) Index. The index includes 19 commodities: aluminum, cocoa, coffee, copper, corn, cotton, crude oil, gold, heating oil, lean hogs, live cattle, natural gas, nickel, orange juice, silver, soybeans, sugar, unleaded gas and wheat with each weighted in order of their importance to global trade. As you can see there is a very high correlation between the Australian resources sector performance and the CRB index over a long period of time (20 years here).
 The interesting part of commodity pricing of course is that they are almost all priced in US dollars. Because of that there is a general understanding that when the US dollar rises, all commodities become more expensive (for the rest of the world) so commodity prices generally fall. US dollar up, commodity prices down. And vice versa.
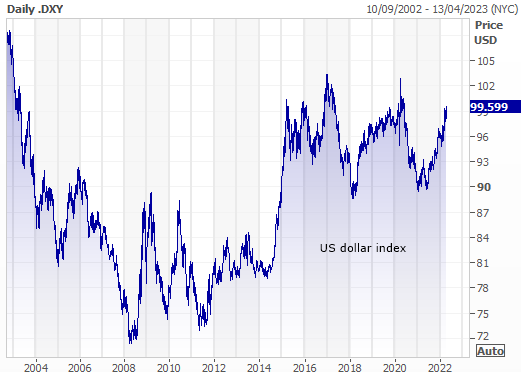
You can gauge how “expensive” the US dollar is from the US dollar index (Code DXY). Here is a chart of the US dollar index – as you can see, in the last year the US dollar has taken off as the currency markets anticipate higher US interest rates (higher rates mean a higher yield on a currency so the currency becomes more attractive and goes up). From the low a year or so ago the US dollar index is up 11.4%. So commodities, without going up in price, are 11.4% more expensive in most countries this year. No wonder there's inflation in Europe.
 The baseline assumption then is that as the US dollar goes up the CRB (Commodity price) index tends to fall. And the correlation, as you'll see below, is pretty tight. Here is the chart – this shows the CRB index again (red) overlaid with the inverse of the US dollar index - this suggests that when the US dollar rises (the blue line goes down) commodity prices usually go down as well. And over the last 20 years, they have. Until recently....
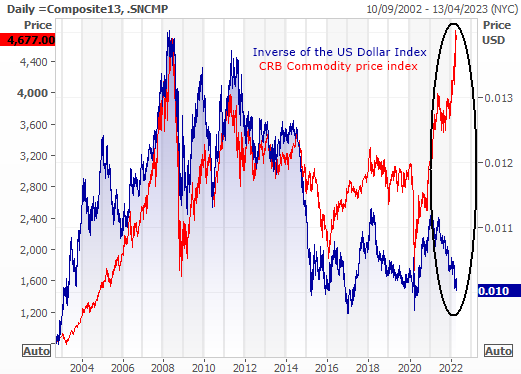
 The situation we have now - commodity prices and the US dollar rising together - is not "normal" and you have to ask….how long can this symbiosis go on? The obvious assumption is that at some point the correlation between the US dollar and commodity prices will resume meaning commodity prices come off, possibly rapidly, because the ‘globe’ cannot tolerate commodity prices and the US dollar rising indefinitely at the same time.
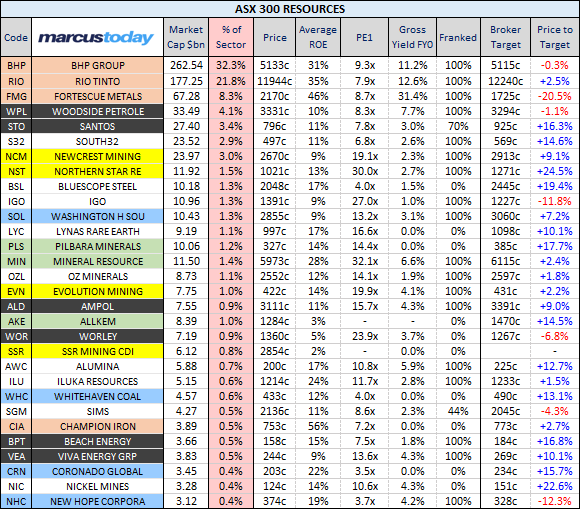 Performance numbers:
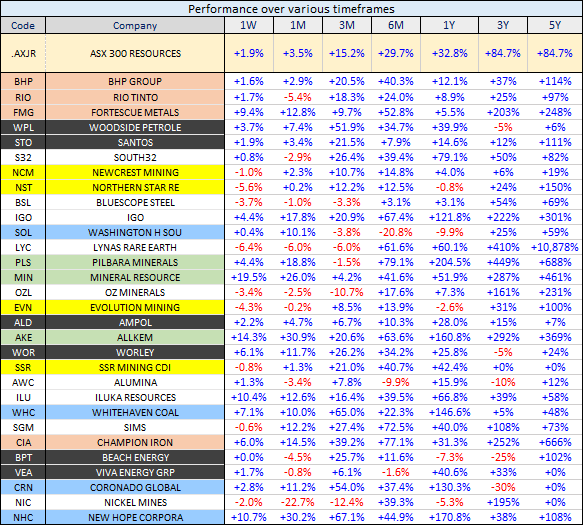
 Some charts (source Refinitiv):
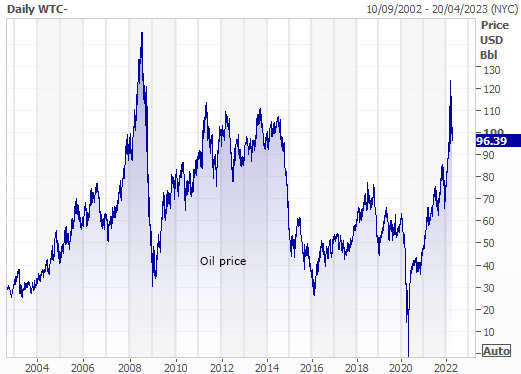
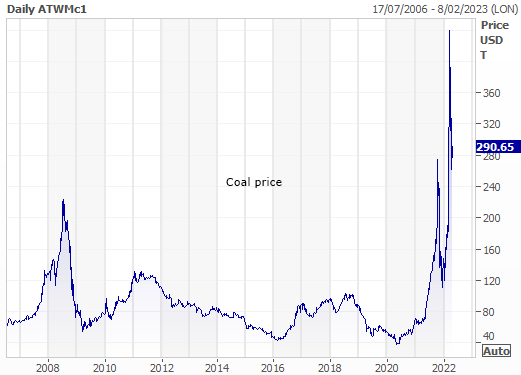
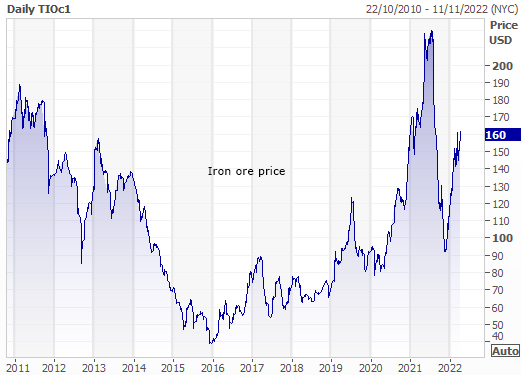
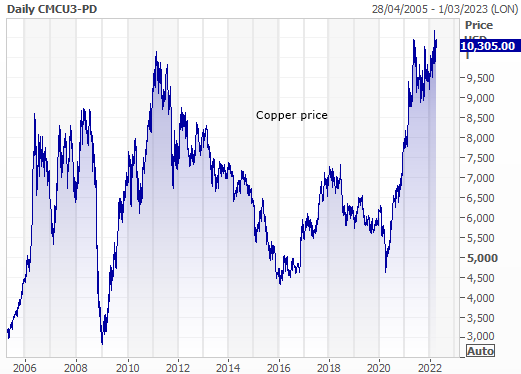
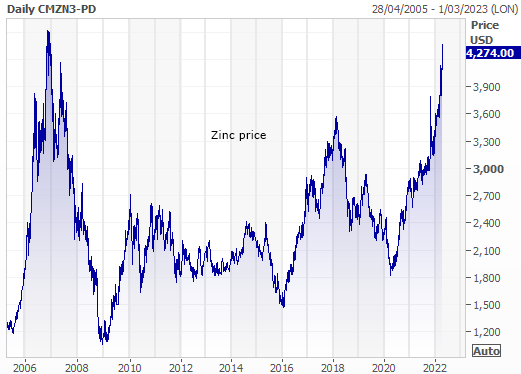
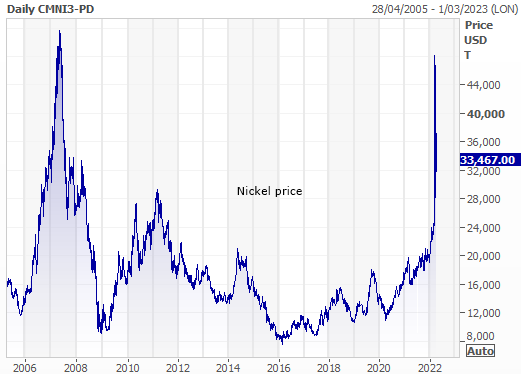
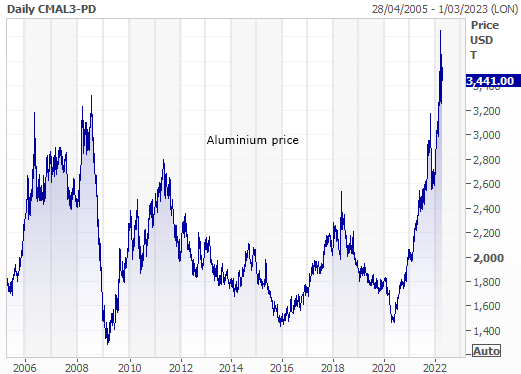
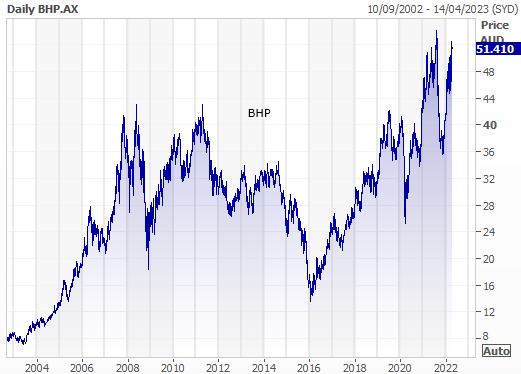
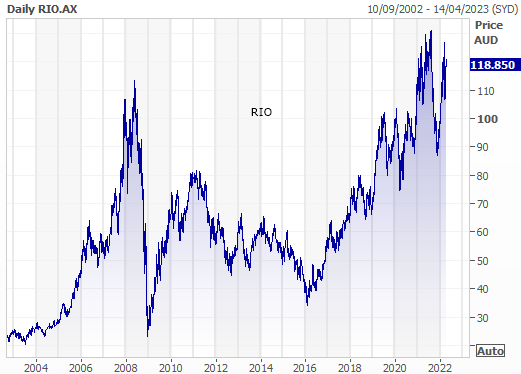


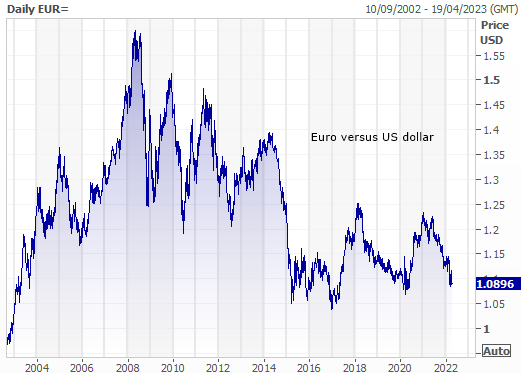
Now imagine what BMW, Volkswagen and Daimler Benz are seeing - the European consumers of commodities. If you put commodity prices in Euros, without commodity prices doing anything, those big car manufacturers are paying almost 50% more than they were ten years ago simply because of the fall in the Euro versus the US dollar. Their buying power is down by a third since the Euro peaked in 2008 and has dropped 12% (that's a big move for a currency) in the last year. If you think the US could be put into a recession by inflation, the risk is 12% higher in Europe because a lot of their input prices (particularly energy) are priced in USD.And this is the point - Over the last year, the correlation between the US dollar and Commodity prices has broken down. Commodity prices have been going up (not down) AND the US dollar has been going up.

The bottom line – We can’t take this resources cycle for granted. One of the biggest risks for Australian investors, who have seen a fabulous run in the resources sector, is a peak in the resources sector. History tells us that the resources sector is a long duration trading sector not an "invest forever" sector. It is not to be trusted. It is to be traded at it's big multi-year pivot points. The sector has led our market. Meanwhile we have a set up that brings the next pivot point closer. One day this commodity price cycle has to end.But as always. Let's not predict, let's react. Don’t sell BHP today. Don’t sell commodities or commodity based stocks today. All that's happened so far is that the chances of a commodity price peak and, therefore, a resources sector peak, has moved from unlikely to inevitable. It just hasn’t started yet. And may not for months. So there's nothing to do yet.
Some Numbers: These won't save you when the top comes.Interested in Marcus Today? This sort of ideas driven content is in the newsletter every day - Sign up for a no-obligation 14-day free trial.


